Lithium-ion Batteries
Air control Engineering Co., Ltd.
Description
Thermal runaway occurs due to the Heat-Temperature-Reaction (HTR) Loop caused by a chain reaction of abnormal temperature increases
- 1 Internal temperature rises due to overcharging, internal short circuits, abnormal heating, or external impacts and damage
- 2 Decomposition of the anode SEI (Solid Electrolyte Interface) occurs around 100~130℃
- 3 In the temperature range of 150-200℃, chemical reactions (intercalation) occur between the anode and electrolyte, leading to the decomposition or deformation of the separator (PE, PP), resulting in large-scale short circuits between the anode and cathode and additional heating, reaching temperatures near 200℃. Decomposition of major carbonate solvents occurs in the range of 90-220℃.
- 4 Decomposition of the cathode material and release of oxygen occur near 210℃
- 5 At around 220-230℃, significant decomposition of the electrolyte's organic solvent components occurs due to a chain reaction of temperature rise, coupled with the decomposition of the cathode material, leading to an increased supply of internal oxygen and amplified oxidation of the solvents
- 6 When temperatures reach 250-300°C, explosive combustion of the solvents occurs
- 7 Around 260℃, the binder PVDF begins to thermally decompose, producing HF or H₂
The key component of the electrolyte, LiPF₆, hydrolyzes to produce HF when moisture is present at temperatures above 70℃ LiPF6 + H2O → LiF + 2HF + POF3
Composition of emissions under Thermal Runaway
- 1 The primary flammable gases emitted during thermal runaway include: Carbon Monoxide (CO), Methane (CH4), Ethylene (C2H4), Ethane (C2H6), Hydrogen Cyanide (HCN)
- 2 Key gas components are: Carbon Monoxide (CO), Carbon Dioxide (CO2), Methane (CH4), Ethylene (C2H4), Ethane (C2H6), Fluoroethane (C2H5F), Hydrogen (H2) & Hydrogen Fluoride (HF)
- 3 GC (Gas Chromatography) analysis of LFP (Lithium Iron Phosphate) and NCA (Nickel Cobalt Aluminum) cells has shown that CO2 is emitted in significantly larger quantities compared to CO, CH4, and C2H4.
Characteristics of Generated Pollutants and Removal Mechanisms
Fluorinated Compounds
LiPF6 decomposes into PF5 at temperatures between 200~240℃
PF5 has a very short residual time
Hydrolysis & Chemical Reactions
LiPF6 → LiF + PF5
PF5 + H2O → POF3 + 2HF
LiPF6 +.H2O → LiF + POF3 + 2HF
- HF Production Rate by LIB
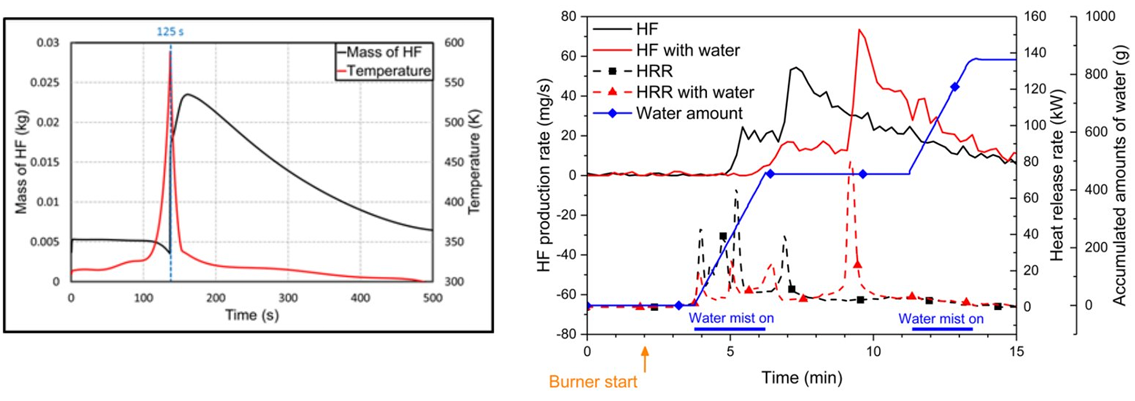
-
Soot Data

During fire testing, soot particles predominantly range in size from 0.1 to 0.4 micrometers (µm).
-
Fume Data
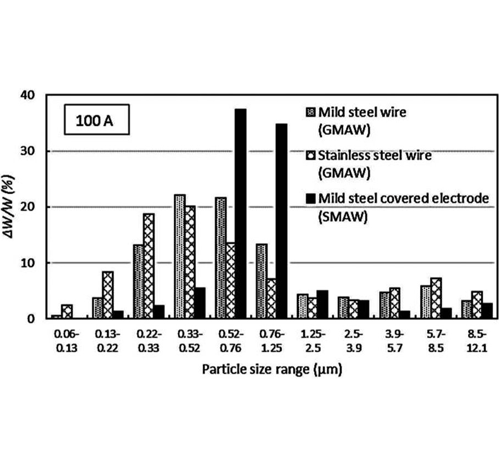
Metal fume particles typically range in size from 0.22 to 0.25 micrometers (µm).
Selection of Dust Collection Equipment Suitable for Removing Particulate Matter (Fume, Soot, etc.)
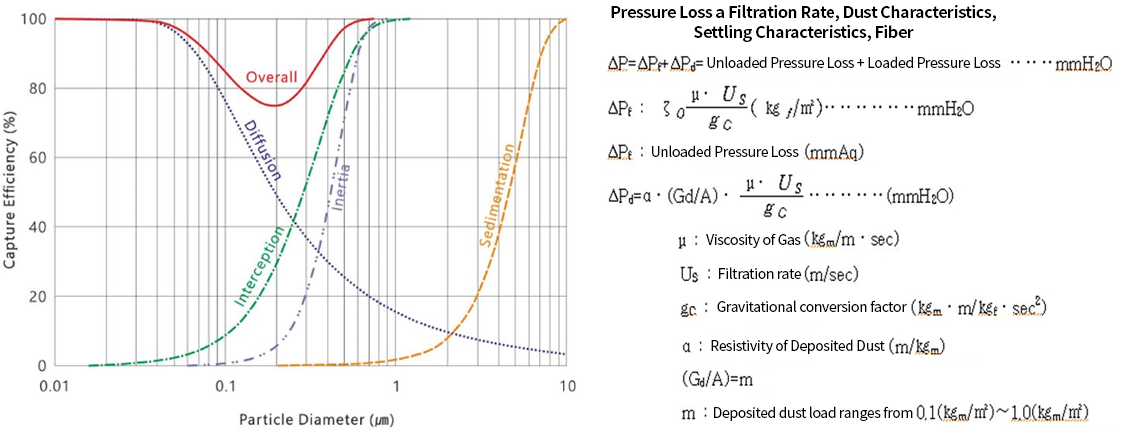
- Fumes and soot in the range of 0.1 μm are effectively removed by mechanisms such as inertia (inertial collision) and interception (blocking)
- Fume and soot are sticky upon deposition and are fine enough to penetrate filter fibers, so surface filtration methods are applied.
- Application of Nano Filters and Air Pulse Jet Cleaning Method
Ultra-Nano Filters
Characteristics of Ultra-Nano Filters
Compared to conventional PE filters, ultra-nano filters are coated with ultra-fine nanofibers, which are one-billionth of a meter in size. This coating creates pores that are over 20 times smaller and denser than those in standard filters.
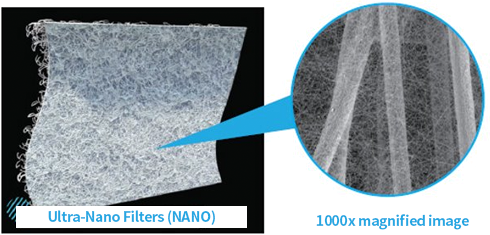
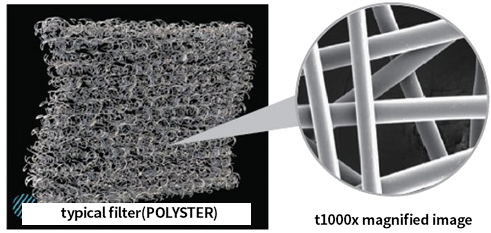
Using surface filtration instead of depth filtration, where particles are trapped between fiber gaps, allows dust to be easily removed during air pulsing, resulting in longer filter replacement intervals compared to standard filters.
Ultra-Nano Filter
Ultra Nano Filter vs. Polyester Filter Performance Summary
| 구분 | Polyester Filter Fabric | Ultra Nano Filter | |
|---|---|---|---|
| Test Condition | Sample Name | 500g | 500g coating |
| Test Method | VDI 3929 part2 | ||
| Air Flow | 3.0m3(m2・min) | ||
| Test Dust | ISO 12103-1A2fine test dust | ||
| Dust Concentration | 5g/m3 | ||
| Pressure Drop at Filter Start of Air Pulse Jet | 12.0 mbar (=122.365863 mmH2O) | ||
| Air Pulse Jet Pressure | 2.5bar | ||
| Test Results | Average Air Pulsing Cycle | 00:28 | 01:12(Longer is better) |
| Amount of Dust Passed | 3.71mg/m^38 | 0.51mg/m^38(Less is better) | |
Test Report for Ultra Nano Filter vs. PE Filter
| Category | PE Filter (Kolon L227) | Imported Nano Filter | Ultra Nano Filter |
|---|---|---|---|
| Particle Size | 0.3~0.5㎛particles | 0.3~1㎛particles | 0.3~0.5㎛particles |
| Removal Rate | 86.2% removal | 85~95% removal | 99.1% removal |
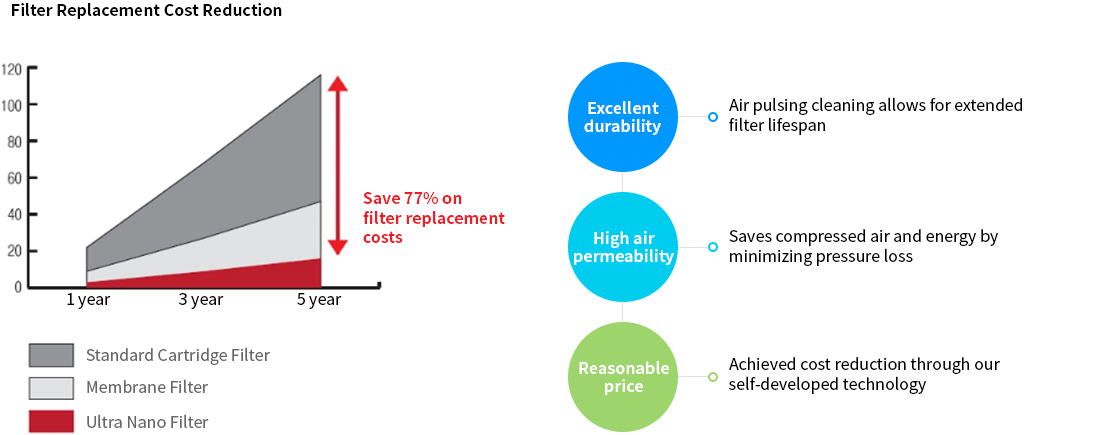
Economic Benefits
Selection of Air Pollution Control Equipment
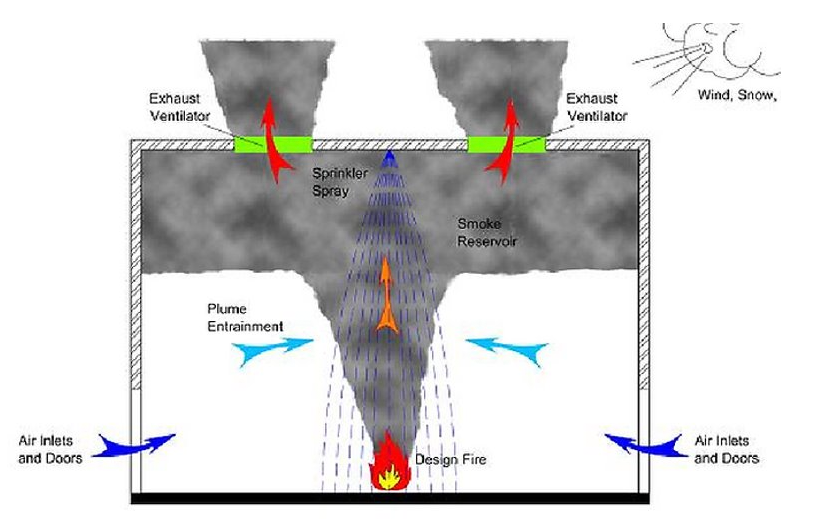
Overview of Research Facilities and Airflow Selection
Toxic combustion gases generated in the fire testing facility are sent to a post-treatment system, where all combustion gases from the hoods are processed simultaneously.
Airflow Determination
- If underestimated, pollutants and smoke may not be effectively removed during experiments.
- If overestimated, it will lead to increased investment and operational costs.
- Currently designed for a ventilation rate of 5 to 15 air changes per hour, the battery fire tests in the fire testing laboratory require careful selection of airflow considering the thermal runaway characteristics.
Considerations for Selecting Dust Collection Equipment
Based on these factors, an appropriate dust collection method can be selected.
| Item | Content |
|---|---|
| Emitted Substances | Dust, hazardous gases (acidic, HF, HCl, SOx, NOx, etc.), VOCs |
| Dust Collection Requirements |
|
Emission Standards and Expected Concentrations
| Pollutant | Emission Allowance (ppm) | Expected Emission Concentration (Laboratory Test) | Remarks |
|---|---|---|---|
| SO2 | 200 | - | |
| NOx | 150 | - | |
| Dust | 30 | 200~4000 | mg/sm3 |
| Carbon Monoxide | 200 | 8000~65000 | |
| Fluorinated Compounds | 2 | 10~20 | |
| Hydrocarbons (THC) | 200 | 3000~80000 | |
| HCN | 4 | 37~170 |
Selection of Air Pollution Control Equipment
Optimal equipment selection involves combining suitable systems based on design experience and the characteristics of combustion gas emissions.
| Emitted Pollutant | Most Effective Equipment | Equipment Selection | Etc |
|---|---|---|---|
| Dust | Filtration Dust Collector (Bag Filter) | Filtration Dust Collector + Adsorption Tower + Scrubber |
|
| THC and Others | Activated Carbon Adsorption Tower (AC Tower) | ||
| Gas-phase Substances | Scrubber (Packed Tower) |
Process Flow Diagram for Vent Gas

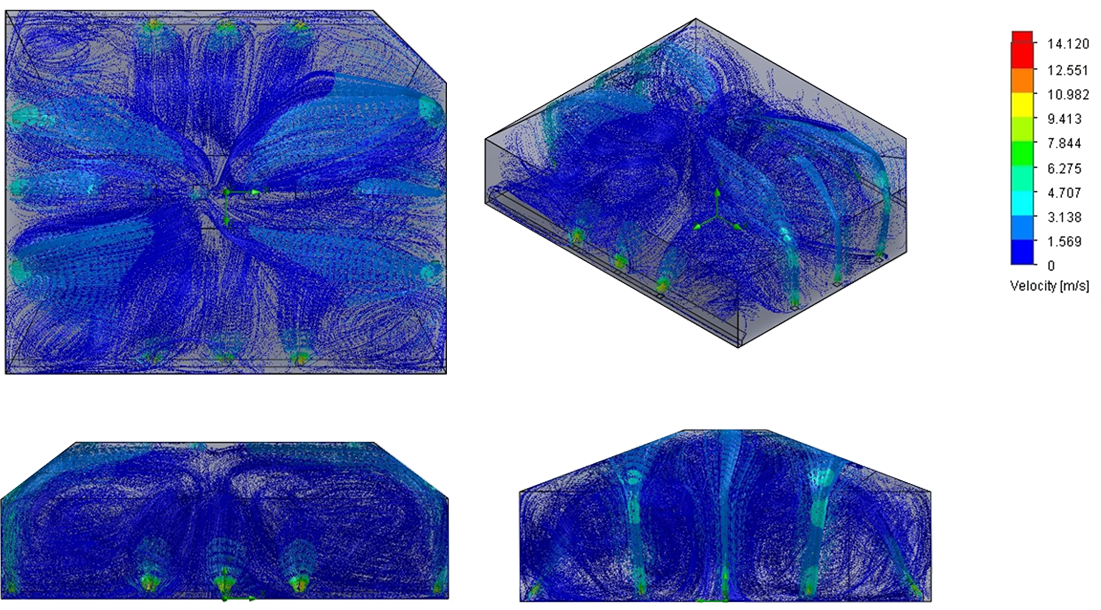
Fire Testing Facility CFD